Paradise · Control Center
June 2026 → July 202610 min read
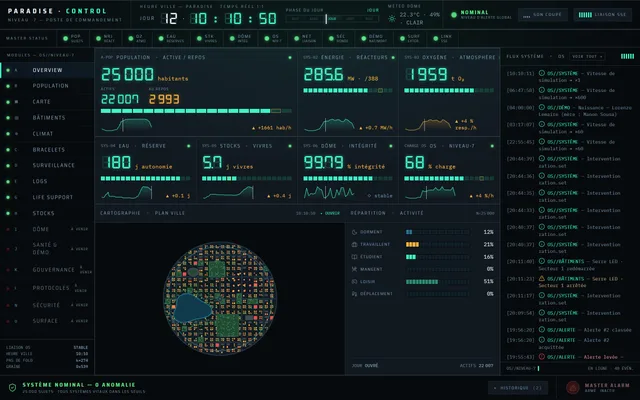
I started this project after watching Paradise, Dan Fogelman’s series: 25,000 people live sealed inside an underground city, three years after a catastrophe. The plot is a murder mystery, but what stuck with me after the episode was the logistics. How you feed a sealed city, where its oxygen comes from, what it costs in electricity to light crops that never see the sun. The show doesn’t answer those questions, so I wanted to see if I could answer them with numbers.
Paradise · Control Center is the command post of that city. The simulation runs nonstop on the server, in real time, so an hour in the city lasts an hour for me too. From there you keep an eye on the reserves, the power plant and every inhabitant, with their bracelet and the cameras that can see them, and you can step in: shut down a greenhouse or a reactor, ration the city, cut a bracelet, freeze a camera. There’s no online version, the project runs on my machine.
No figure set by hand
That’s the rule I set myself from the start. Almost everything on screen is computed from about ten real-world constants, like the oxygen, water and calories a person needs each day, or what a small nuclear reactor delivers. Each one comes from sources like NASA or the FAO, and is written down in a document in the repo, with its formula, before being coded.
The rule takes more work than it sounds. I can’t tweak the model to get a result I like, so I have to find the sources, write them down, and sometimes push a feature back for lack of data. In exchange, every figure on screen traces back to a cause, and the city’s most interesting behaviours showed up without me programming them.
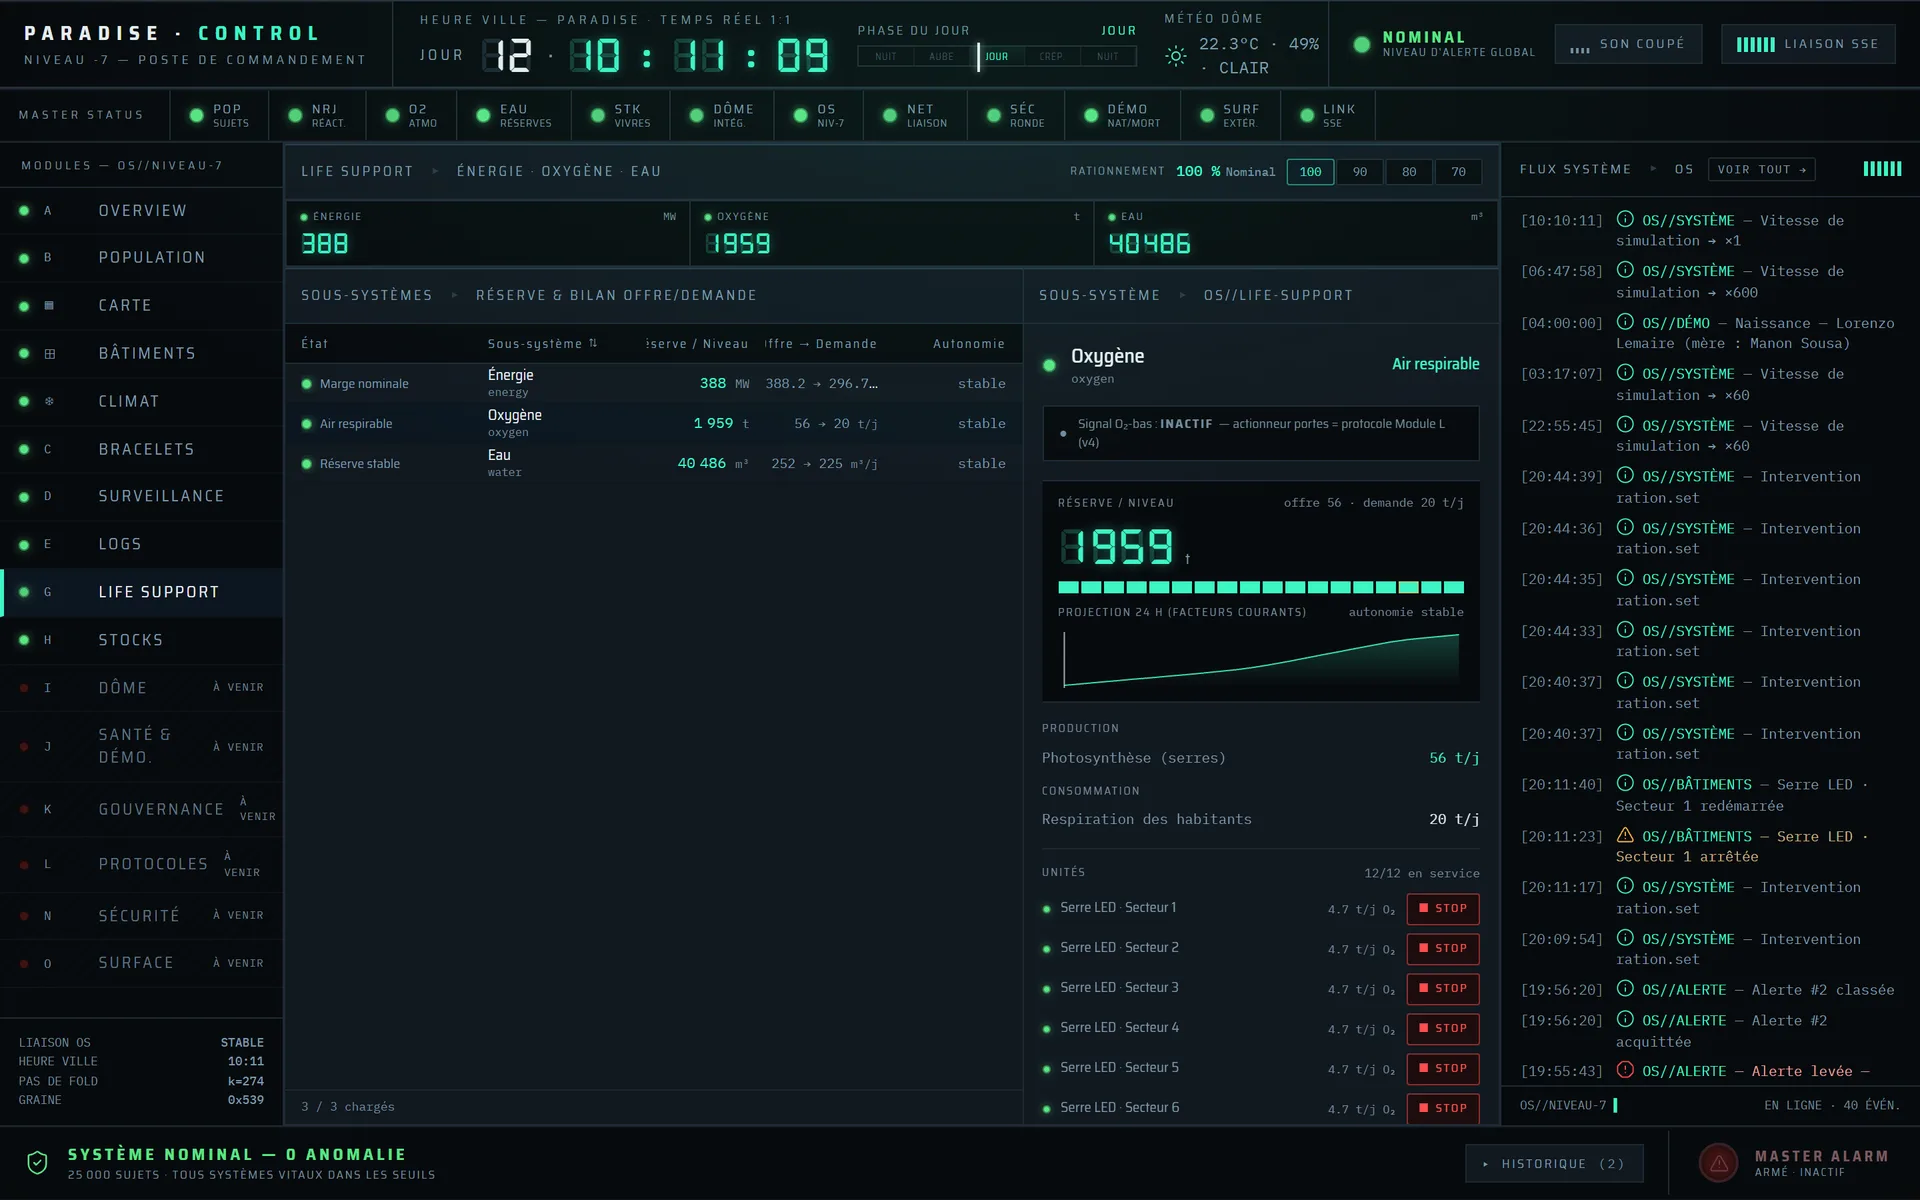
Air is a good example. The greenhouse area is set by calories, and it takes far more plants to feed 25,000 people than to recycle their air. As a result, the greenhouses make almost three times more oxygen than people breathe, as the life-support dashboard shows.
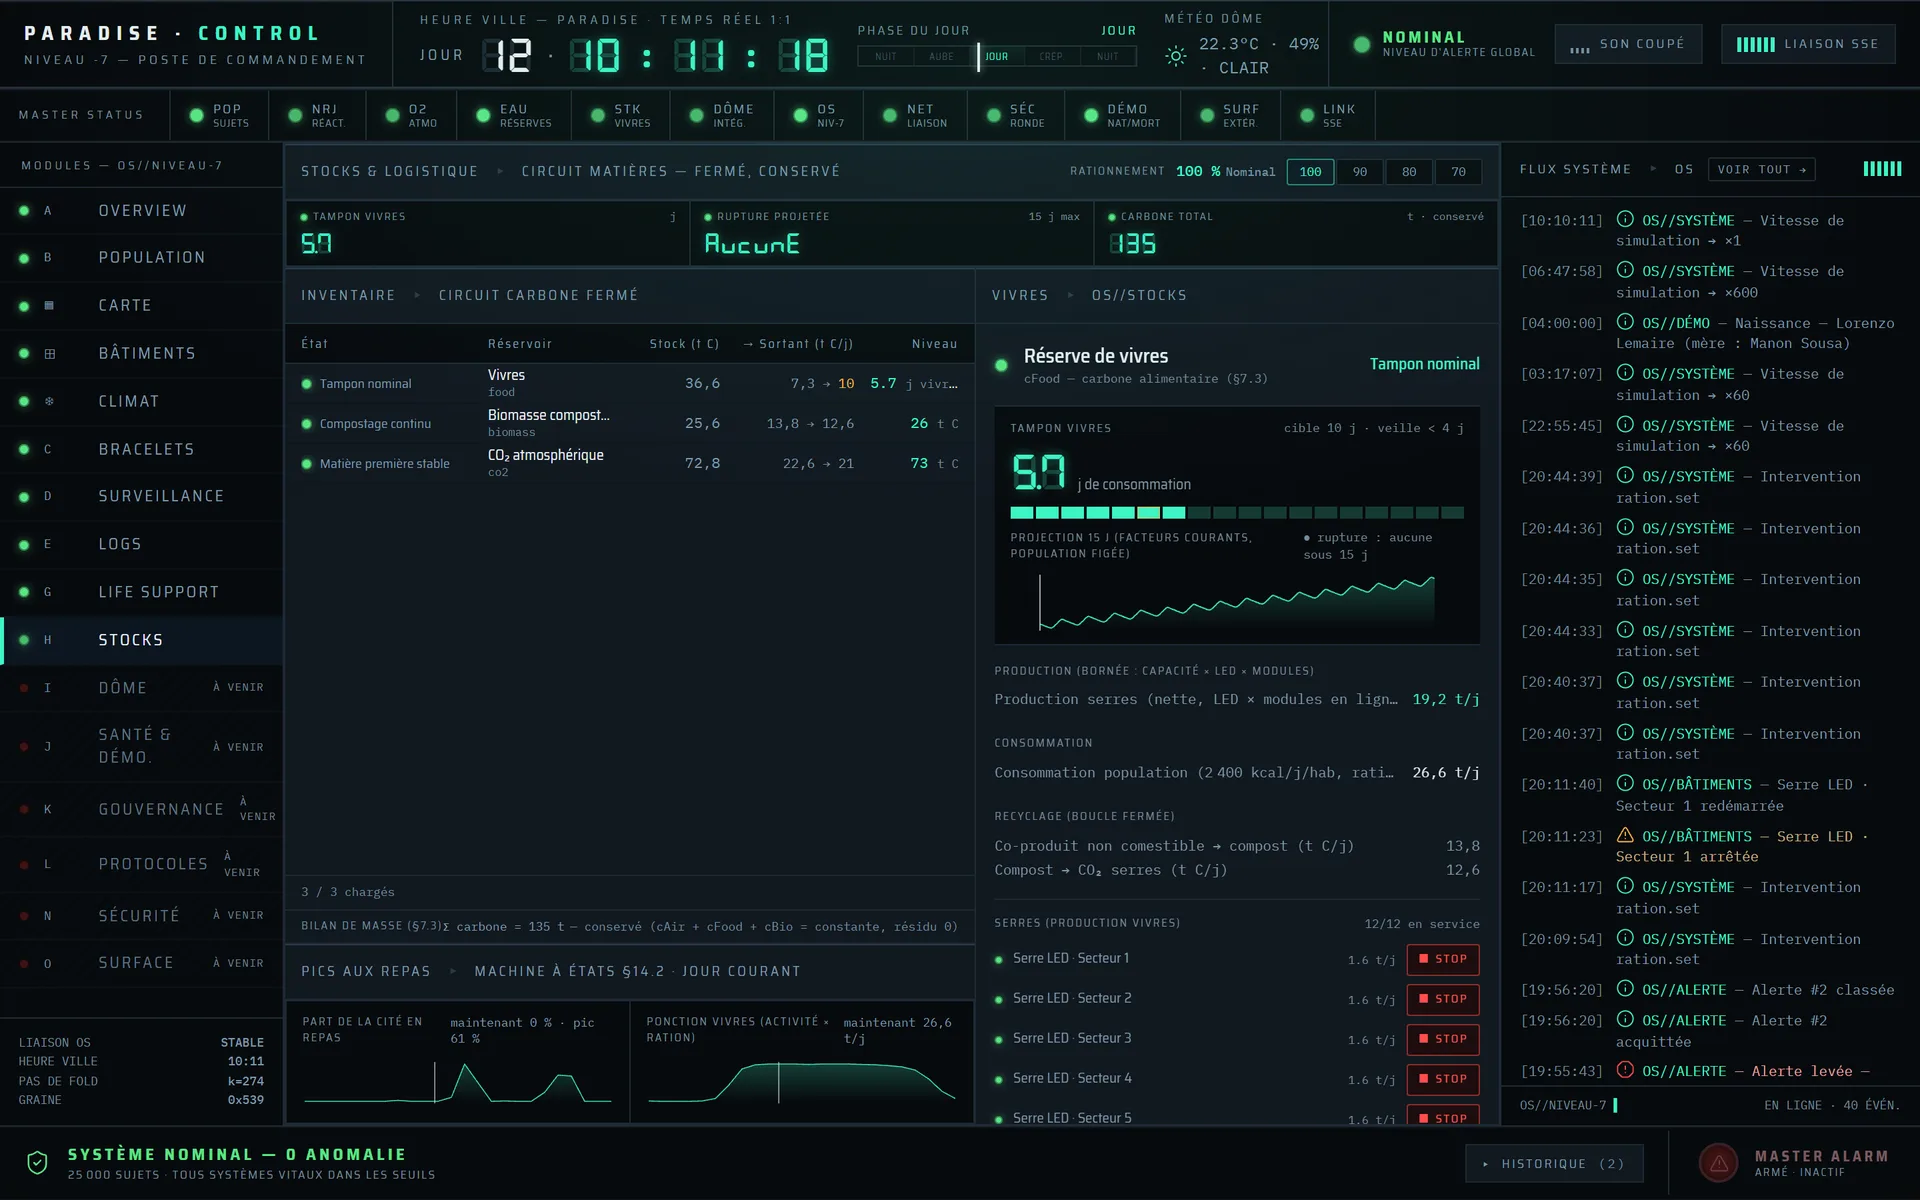
The real issue is carbon dioxide. Plants and humans don’t swap gases in the same proportions, so carbon dioxide slowly runs out. Composting the greenhouse waste makes up for it by putting its carbon back into the air. Nothing enters or leaves the city, and the total amount of carbon doesn’t move by a single gram over thousands of hours, because stocks are counted in integers rather than decimals. The stocks view follows that loop.
Power, heat and water
The greenhouses alone take more than 80% of the electricity, and they set the size of the power plant: seven small reactors, six running and one to cover refuelling. When the plant loses power, life support is served first and the greenhouses get what’s left. So a failure cuts the harvest without ever cutting the air, and hunger shows up weeks later.
As for heat, if I stop a cooling unit, the temperature climbs slowly for a few hours then levels off, because the hotter the city gets, the more heat the surrounding rock absorbs. And since cooling uses electricity, a hotter city grows a bit less food when the grid is already tight.
For water, the first version was a countdown: a six-month reserve draining away, and the city dying on schedule. I didn’t want that, but I didn’t want to drop the constraint either. So I added a reclamation plant, sized on demand like everything else. As long as the population stays within what it covers, the reserve holds steady, and beyond that, shortage shows up on its own.
Births and deaths
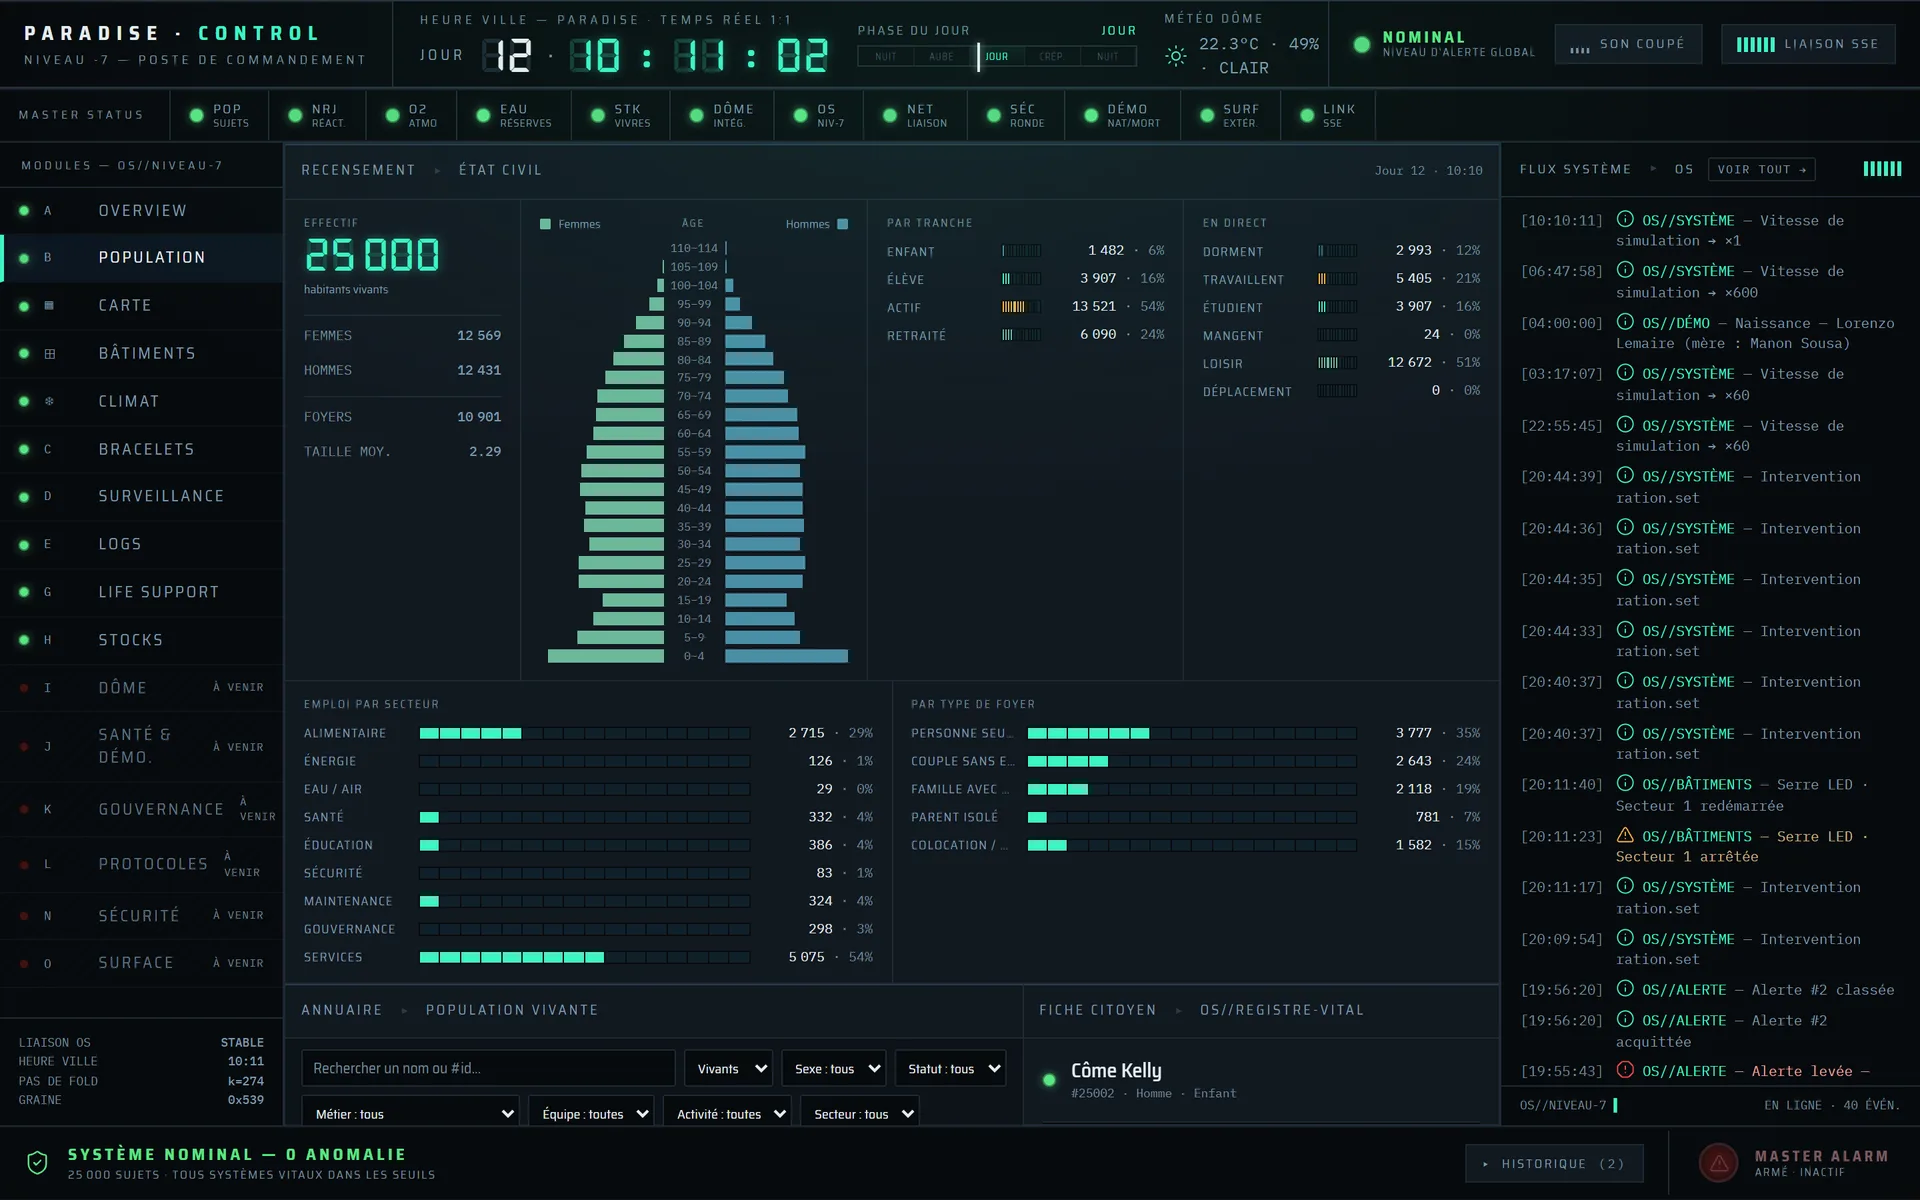
The population isn’t written anywhere either. Every hour, each inhabitant has a risk of dying that roughly doubles with every eight years of age, and births depend on how many women there are at each age. Even the starting age pyramid comes from that rule. The census shows it, along with households and jobs.
When a vital resource runs short, there are fewer births and extra deaths, only for the share of the population the city can no longer support, spread over about two months, which is how long a human lasts without food. It sorts itself out, since resources become sufficient again as the population falls.
That’s the result I wanted to see, because none of it is programmed. If I bring the greenhouses down to just over half their output, the population drops by about half, then settles instead of dying out. If I shut them all down, food lasts nine and a half days. With rations at 70%, the minimum used by the FAO, it lasts a little over thirteen days.
Everyone’s day
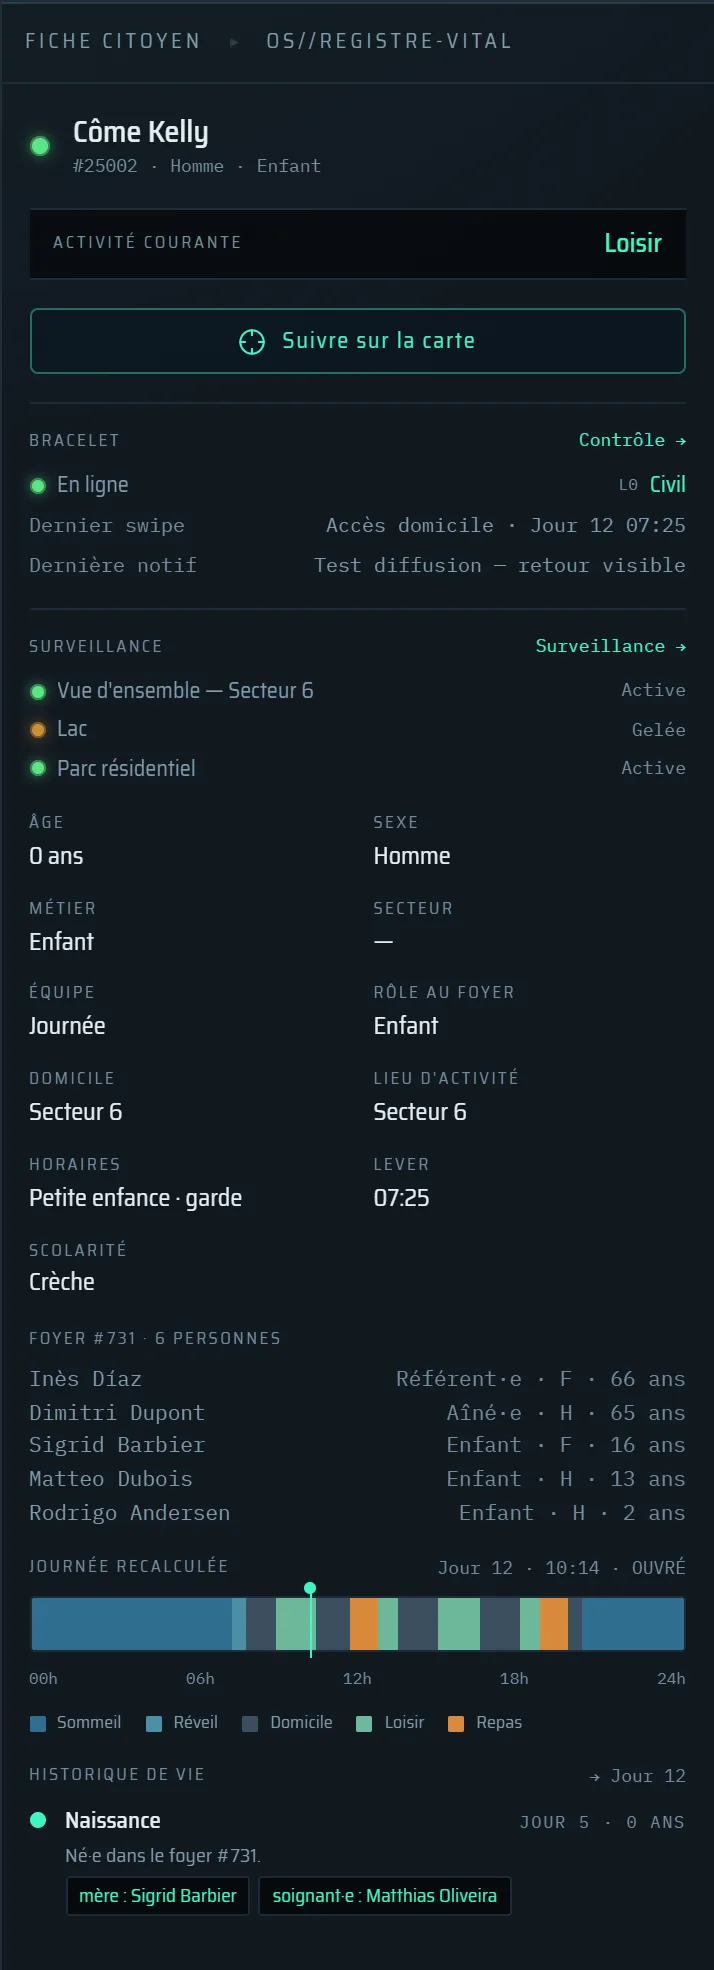
Every inhabitant has a job drawn from what the city needs, a household and a routine, with day and night crews that rotate every week. Yet almost nothing is stored per inhabitant: their birth, their death if any, their sex, their household and an ID, in typed arrays where all 25,000 fit in under a megabyte. Everything else is recomputed on demand from the world seed and the time. The profile of this baby, born during the simulation, is rebuilt entirely that way.
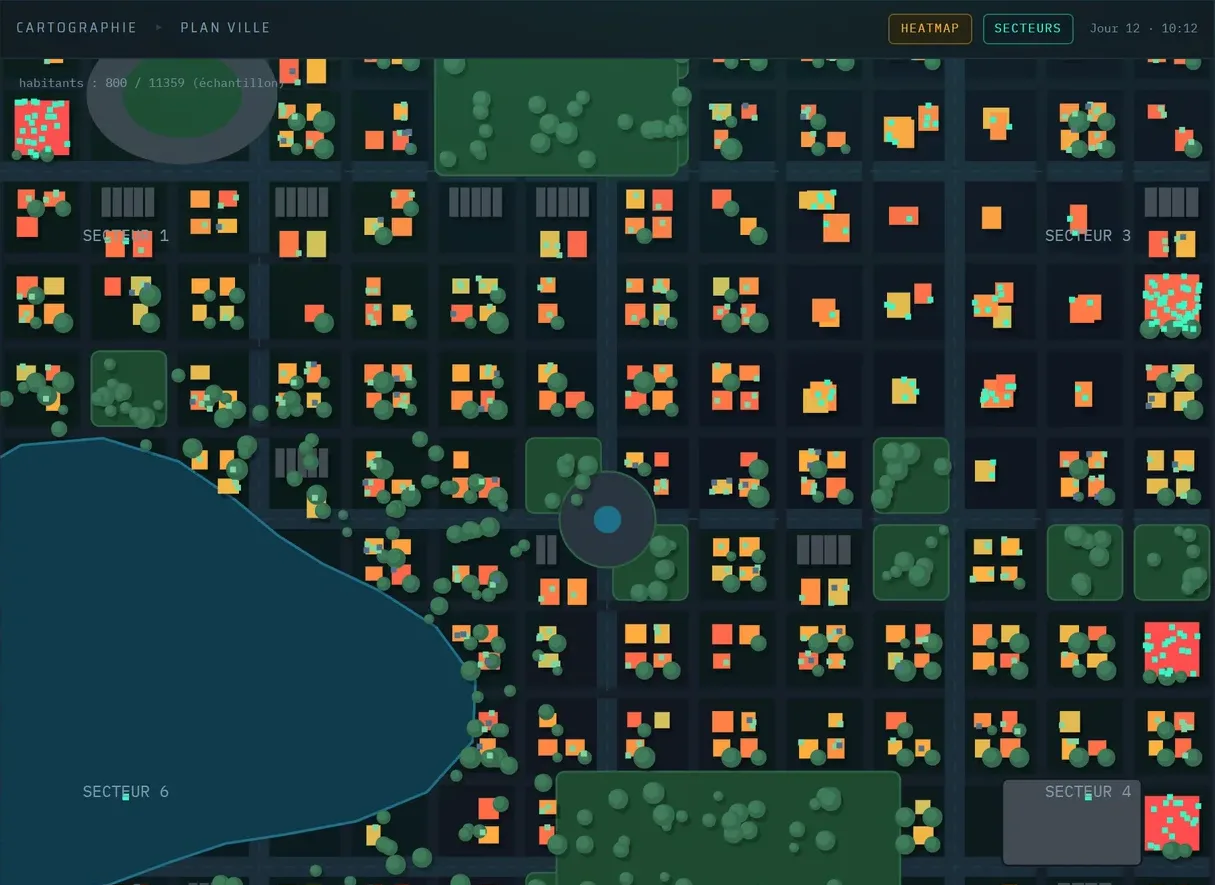
On the map, each inhabitant is placed in a real building. The server never sends all 25,000 positions at once, only a sample of what’s on screen.
That level of detail has its traps. At noon, a reactor crew would go to lunch and the control room would show up empty. Staff at critical facilities now count as present for their whole shift, breaks included.
The browser computes nothing
The city’s state comes down to three things: the world seed, the time elapsed and the list of my interventions. Saves are just a cache, since replaying ten years from the founding takes under a quarter of a second. The engine could even catch up on the time the server was off, but I chose to have the city pick up where it left off. After a week of downtime, I didn’t want to come back to births, deaths and shortages that nobody saw happen.
On the technical side, it’s a Bun monorepo in three parts. The Elysia server runs the engine, serves it over REST and SSE and saves to SQLite. The front end, in Vite, React 19 and Tailwind, only displays. In between, a shared package holds the exchanged types and the city clock calculation. So the browser has no game rules and no clock of its own. When the connection drops, it freezes the time on the last value received and says so, instead of ticking through seconds nobody computed.
Written entirely by Claude
This is the first project I carried from start to finish without writing the code myself. All of Paradise was written by Claude Code from my prompts. I decided what to build and in what order, picked the technologies, settled the design before the first line of code, and set the rules. Nothing was delivered without tests, type-checking, lint and build all green, or without being tried for real in the browser. After each module, agents hunted for defects, others tried to refute them, and I only kept what held up.
Early on, the exercise is great for clearing up your ideas. Stating an intention and getting it back as closed questions forced me to settle things I’d have left vague. Research is the other big win: finding, cross-checking and documenting figures from physiology, agronomy and nuclear engineering would have been a project of its own. Then there’s the speed. When I said a stream of readings was drowning the real events in the log, it was gone within half an hour.
After about twenty iterations, I got tired of it, and the reason is simple: I’d lost my grip on what was happening. By the end, I couldn’t tell you how a good part of the code worked, and if I picked Paradise back up today, I’d need some serious reading time before touching anything. The tests and reviews checked things I no longer read, but that doesn’t replace knowing your own code.
For this project, the trade-off is still well worth it. The goal was personal: to watch a city live. I watched it grow week after week, with a level of detail I’d never have reached otherwise, and it was genuinely fun. On a project I’d have to maintain over time, or work on with others, I’d go about it differently. That’s what I do on Nooki: it’s written entirely with Claude too, but this time I keep it on track.
Where the project stands
Paradise has been on hold since 26 July 2026, with all its tests green and roughly half of the planned modules done. Health, governance and emergency protocols were never started.
I’m stopping for a reason I hadn’t seen coming. By building lever after lever, I realised I’d rather watch the city live than steer it. Cutting a bracelet, freezing a camera or rationing the city was the original idea, the one that came from the show. What keeps me in front of the screen is the age pyramid shifting on its own.
If I ever pick it up again, I’ll restart a good part of the code from scratch, and change two things in how I work. First, split the logic into much smaller pieces, each testable on its own, to stay in control of a project this size. Second, review every technical choice one by one, and above all look closely at how each figure is computed, because that’s where you really understand the model, and it’s what I was missing by the end. The subject still interests me, and this engine could be the base for other life simulations.